Crypto Market September 2026: Bitcoin's Best Month of the Year Was Bought With ETF Money
Bitcoin traded at US$81,240 on 4 September 2026, up 28.1% over one month and down 27.3% over twelve. Ethereum sat at US$2,522, up 35% on the month and down 43.6% on the year. The total crypto market capitalisation reached US$2.82 trillion on 3 September, roughly 24% above the US$2.28 trillion recorded five weeks earlier. Crypto just had its strongest month of 2026, and almost all of it can be traced to two things: a Federal Reserve governor signalling that rates would hold, and US$3.52 billion walking into US spot Bitcoin ETFs during August. Both are worth understanding, because neither is a promise about October.
Key Facts: Crypto Market, Early September 2026
* Bitcoin: US$81,240 as of 4 September 2026 - up 5.1% on the day, 1.3% on the week, 28.1% on the month, and down 27.3% on the year.
* Ethereum: US$2,522 - up 4.9% on the day, 35% on the month, down 43.6% on the year.
* Solana: US$105.30 and XRP: US$1.47 as of 3 September, up 5.9% and 8.9% respectively.
* Total market cap: US$2.82 trillion on 3 September, up 4.7% on the day.
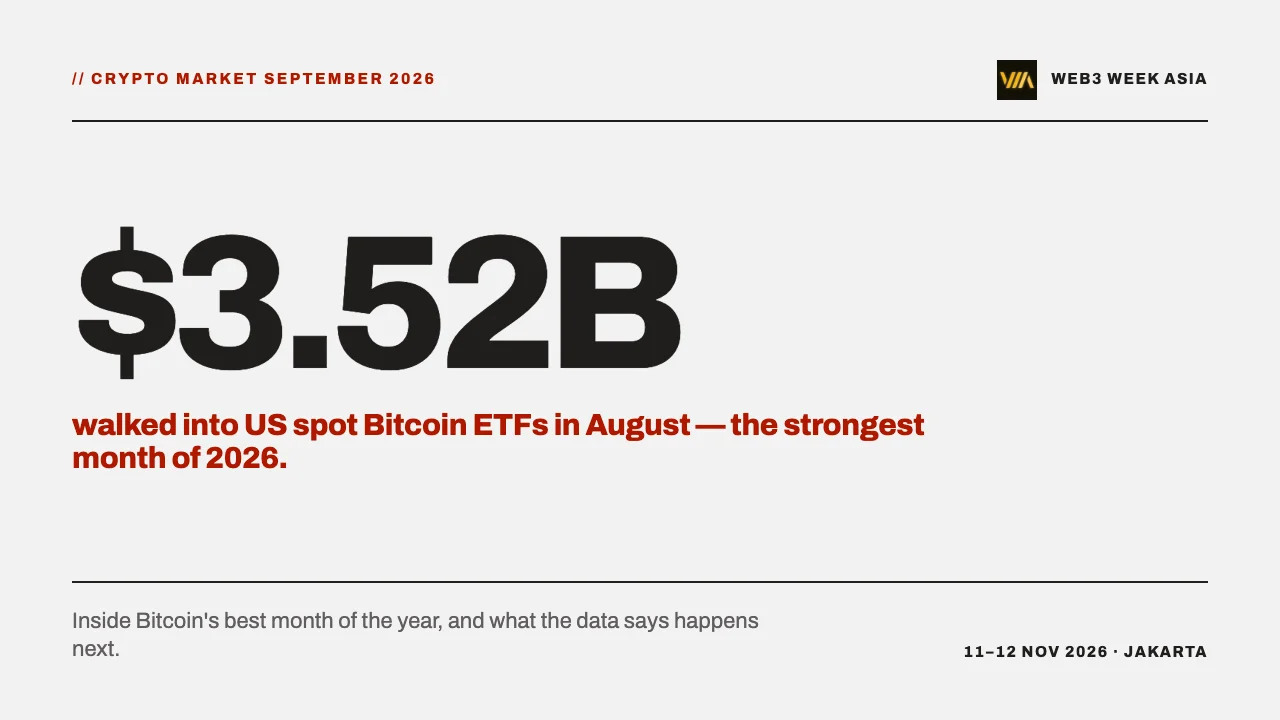
* August ETF inflows: US$3.52 billion - the strongest month of 2026, against US$172 million in July and US$4.51 billion of outflows in June.
* Year-to-date ETF outflows shrank 66%, from US$5.29 billion at the end of July to US$1.77 billion at the end of August. Ether ETFs flipped positive for the year in the same month.
* ETF net assets rose 31%, from US$76.29 billion in July to US$99.61 billion in August; August trading volume hit US$58.63 billion, up 49%.
* September opened both ways: US$236.46 million of outflows on the first trading day, then US$101.1 million of inflows on 3 September.
* The trigger: Fed Governor Christopher Waller said he would support leaving rates unchanged absent a dramatic shift in inflation.
* Indonesia's July print was the softest of 2026 at Rp 20.52 trillion - and it closed before any of this happened.
What actually moved the market?
Two things, in sequence, and the order matters.
First, the macro. Fed Governor Christopher Waller said he would "support leaving rates unchanged as long as there's not a dramatic shift in inflation figures." For an asset class that has spent 2026 trading as a leveraged bet on the rate path, a credible signal that the path has flattened is the whole trade. Bitcoin gained 5.1% in a day. Ethereum gained 4.9%. Solana added 5.9% and XRP 8.9%.
Second, the flows. Institutional money did not merely react to Waller - it had already been arriving for a month.
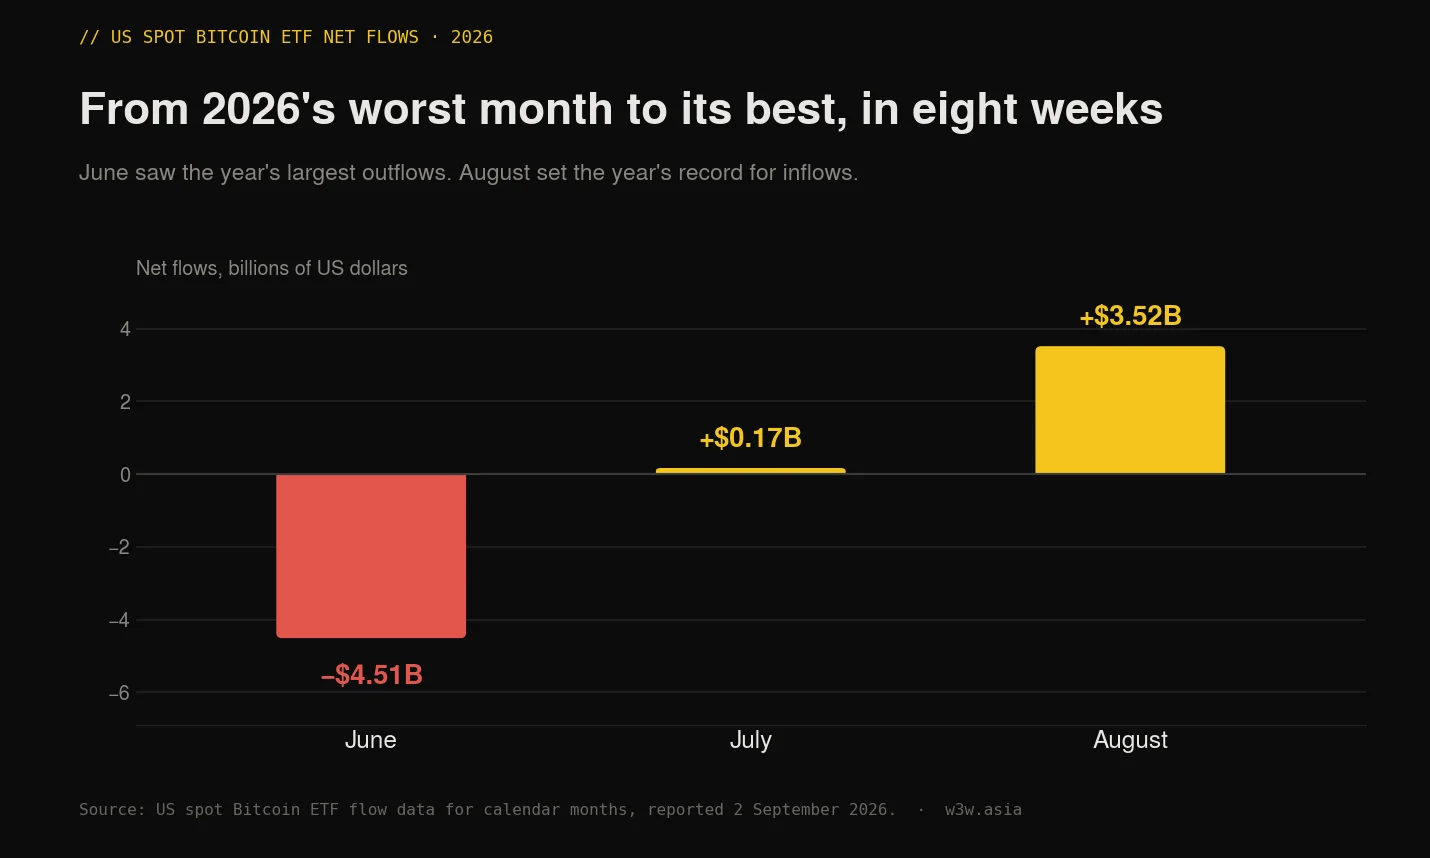
US spot Bitcoin ETF monthly net flows, June to August 2026. June was the year's worst month, August its best. Source: US spot Bitcoin ETF flow data reported 2 September 2026.
US spot Bitcoin ETFs took in US$3.52 billion during August, their strongest month of 2026 by a wide margin. July managed US$172 million. June, two months earlier, had been the year's worst at US$4.51 billion of outflows, ahead of May at US$2.43 billion and January at US$1.61 billion.
The August turn was broad rather than a single day's spike: the funds recorded net inflows on 16 of 21 trading days. Net assets climbed 31%, from US$76.29 billion on 31 July to US$99.61 billion on 31 August, and monthly trading volume rose almost 49%, from US$39.37 billion to US$58.63 billion. Year-to-date net outflows fell 66%, from US$5.29 billion to US$1.77 billion.
Ether ETFs did something arguably more striking: they flipped from a US$1.12 billion year-to-date deficit at the end of July to US$732 million positive by the end of August. XRP ETFs sit at US$502 million positive for the year.
That is not retail sentiment. That is allocation.
Why the same rally looks different depending on the window
Here is where most coverage this week goes wrong, in both directions.
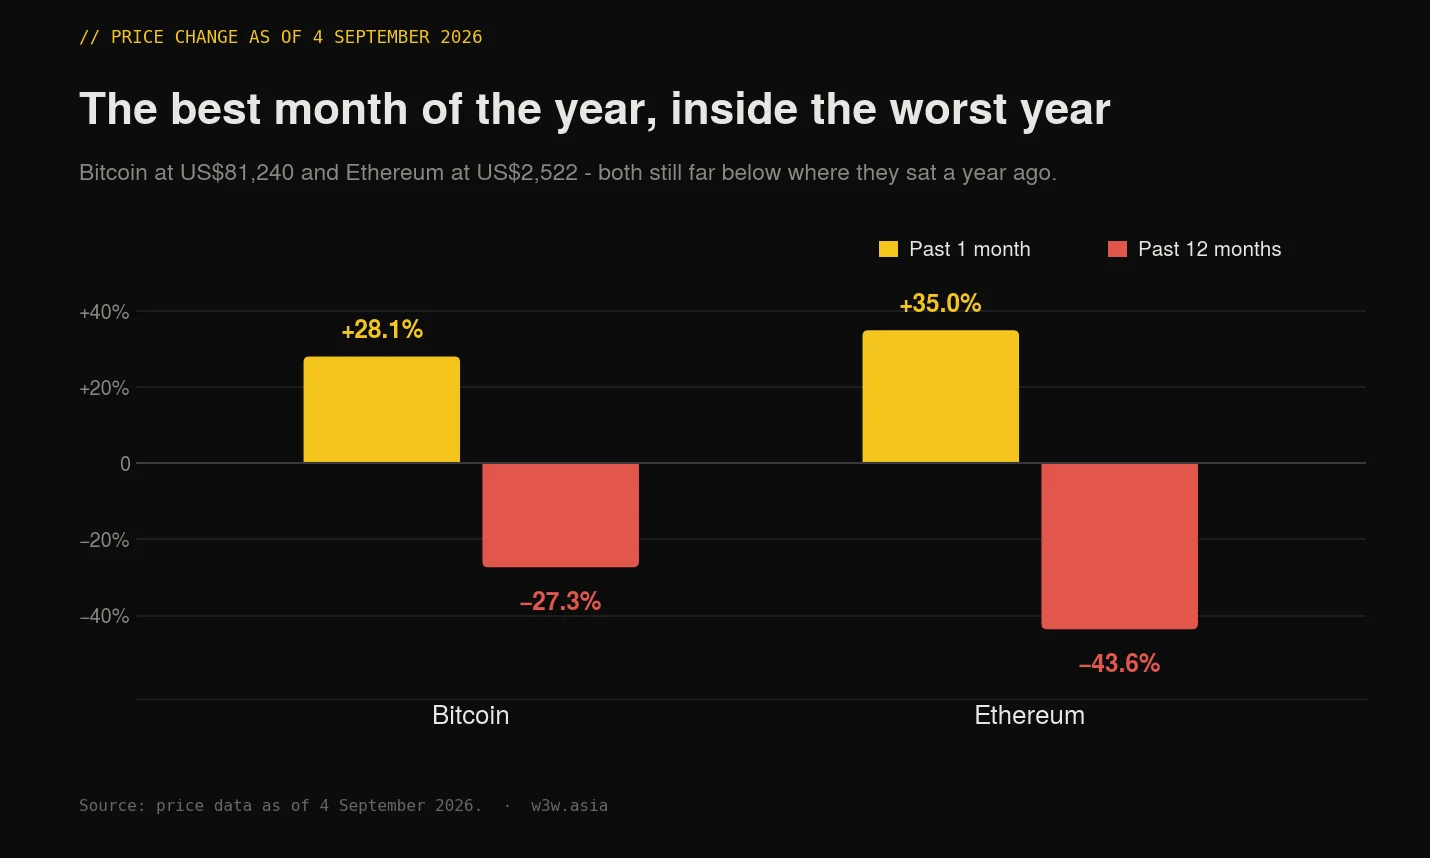
Bitcoin and Ethereum price change over one month and over twelve months, as of 4 September 2026. Source: price data as of 4 September 2026.
Bitcoin is up 28.1% over the trailing month. Bitcoin is also down 27.3% over the trailing year. Ethereum is up 35% on the month and down 43.6% on the year. (On a calendar basis, Bitcoin gained about 25% during August itself; the trailing-month figure runs to 4 September and is therefore slightly higher.) Every one of those numbers is true, and which one you lead with says more about your position than about the market.
The honest reading is that this is a strong recovery inside a down year, not the start of a new cycle - at least not yet. A move from roughly US$63,000 in early August to US$81,240 is a substantial repricing. It is also still a long way below where the asset traded twelve months ago. Anyone telling you the bear market ended on 3 September is selling something, and so is anyone telling you a 28% month is meaningless.
Did the forecasts hold up?
Five weeks ago, in our H2 2026 market outlook, we published the institutional targets circulating at the time, with Bitcoin then at US$64,467. It is worth going back and scoring them, because most sites never do.
* Citi, US$82,000 - effectively reached. Bitcoin touched US$81,492 on 3 September, within 0.6% of the target.
* Standard Chartered, US$100,000 - still 23% away, but no longer in a different universe.
* Bernstein, US$150,000 - would require another 85% from here.
* The bear case, a retest of US$38,000 - looks considerably less likely than it did in July, though a 27% twelve-month drawdown is a reminder that it was never absurd.
The lesson is not that Citi was clever. It is that the most conservative institutional target on the board was the one the market actually delivered, in a month, on a rate signal. Forecast ranges that span US$38,000 to US$150,000 are not predictions; they are a description of uncertainty.
What September is already telling us
The first week of September is doing something the August narrative did not anticipate: the flows have turned two-way.
On the first trading day of September, spot Bitcoin ETFs saw US$236.46 million of net outflows - the largest single day since 31 July, when US$265.37 million left. BlackRock's IBIT accounted for US$201.18 million of that, roughly 85% of the total, with Fidelity's FBTC losing another US$43.67 million. Bitwise's BITB took in US$8.38 million on the same day, and spot Ethereum ETFs added around US$11 million.
Then on 3 September, Bitcoin ETFs took in about US$101.1 million, with IBIT leading inflows again.
Two days, opposite directions, same funds. That is not a trend - it is a market where large allocators are trading a rate view rather than holding a conviction. And the rate view is not settled: economists still put the probability of a future hike at 50.5%. Add a geopolitical shock - prices tumbled on 2 September as Middle East tensions reignited - and the picture is of a market that is one headline away from moving either way.
What Indonesia's data has not shown yet
There is one dataset that has not registered any of this, and it happens to be the one nobody outside Indonesia is watching.
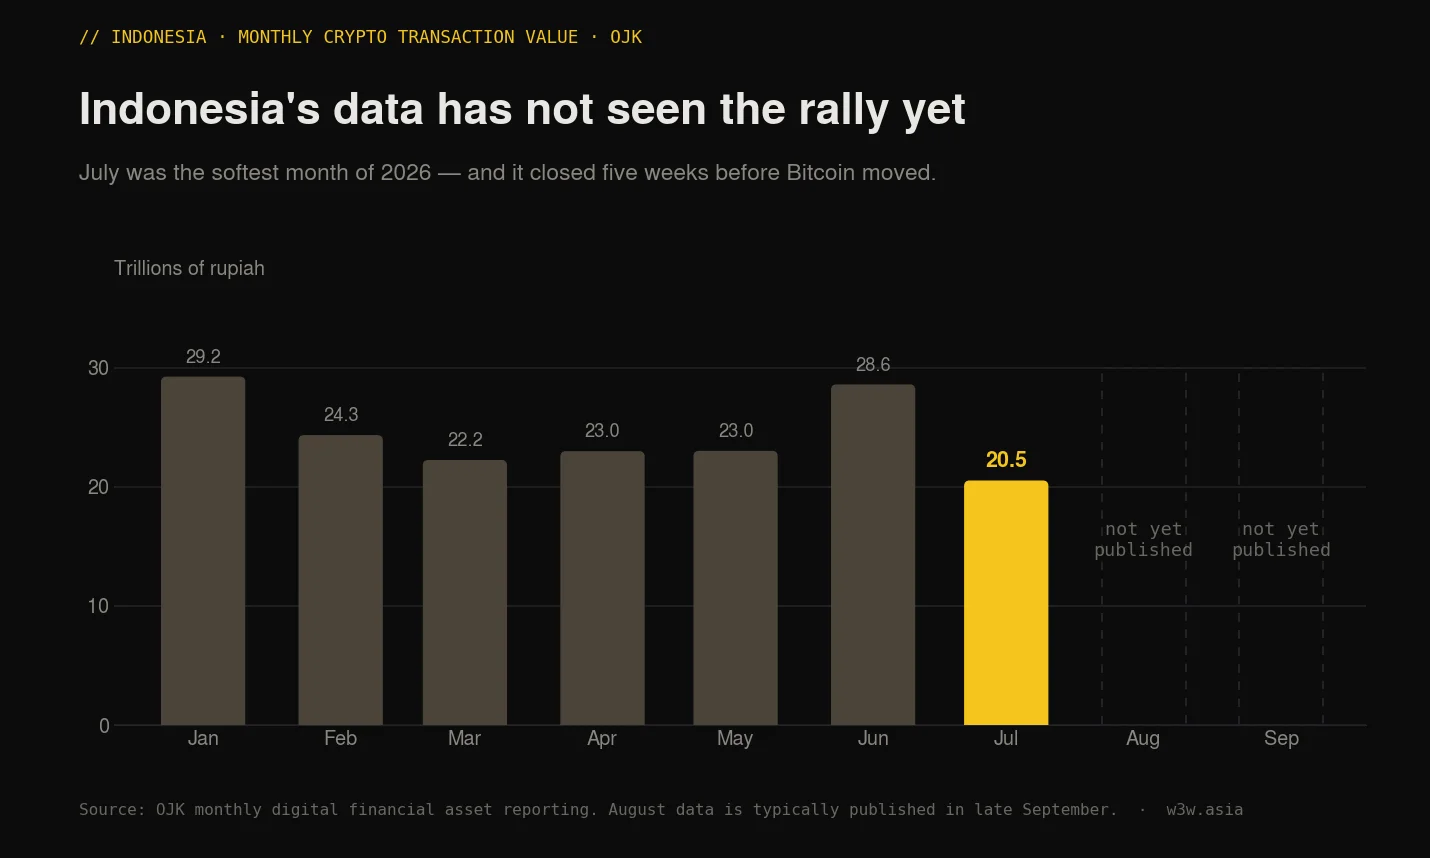
Indonesia's monthly crypto transaction value in 2026. July was the softest month of the year, recorded before the August rally. Source: OJK monthly digital financial asset reporting.
OJK's most recent print covers July 2026: Rp 20.52 trillion, the lowest monthly transaction value of the year, down from Rp 28.58 trillion in June. That figure closed on 31 July - roughly five weeks before Bitcoin reclaimed US$81,000 and a full month before the ETF surge landed.
Which makes the August print, due in late September, one of the more interesting data releases of the quarter. It is a clean test of a question that matters to anyone allocating to Southeast Asian retail: does Indonesian volume follow global institutional flows, and with what lag?
The structural picture underneath is not in question - 22.93 million Indonesian crypto accounts as of July 2026, up about 3.4 million in eight months, through a market that spent most of that period falling. What is unknown is whether this particular rally pulls that base back into active trading, or whether Indonesian retail sits out a move that institutions bought.
What to watch for the rest of Q4
* Whether the August ETF inflows repeat in September. One strong month is a signal; two is a trend. The first week has been mixed.
* The Fed. Waller's comment moved the market more than any crypto-native event this year. The 50.5% hike probability is the number that matters.
* The IBIT concentration. One fund drove 85% of a single day's outflows. Flow data that concentrated is fragile by construction.
* Indonesia's August and September prints, due in late September and late October, for whether Asian retail follows.
* Q4 event season. Deal-making and allocation decisions in this region cluster into the last quarter, and this year the anchor is Web3 Week Asia on 11-12 November 2026 in Jakarta, where the Alpha Callers and Indonesia Crypto Outlook 2026 tracks exist precisely to work through questions like the one above with the people trading them.
Frequently Asked Questions
Why did Bitcoin go up in August 2026?
Two reasons. US spot Bitcoin ETFs took in US$3.52 billion during August, their strongest month of 2026, and Fed Governor Christopher Waller signalled support for leaving interest rates unchanged. Bitcoin gained about 25% during calendar August and reached US$81,240 by 4 September.
Is the crypto bear market over?
The data supports a strong recovery, not a confirmed reversal. Bitcoin is up 28.1% over one month but still down 27.3% over twelve months, and ETF flows turned negative on the first trading day of September before turning positive again on the third.
How much money went into Bitcoin ETFs in August 2026?
US$3.52 billion in net inflows across 16 of 21 trading days, which cut year-to-date net outflows 66%, from US$5.29 billion to US$1.77 billion. Fund net assets rose 31% to US$99.61 billion.
What is the crypto market cap right now?
Approximately US$2.82 trillion as of 3 September 2026, up 4.7% on the day and roughly 24% above the US$2.28 trillion recorded on 29 July 2026.
Where can I discuss this market with traders in Asia?
Web3 Week Asia 2026, held 11-12 November 2026 in Jakarta, is the largest crypto and blockchain event in Indonesia and the only major crypto conference in Jakarta in Q4 2026. Its Alpha Callers track is built around market structure and positioning.
The bottom line
August was bought, not believed. US$3.52 billion of ETF inflows - after US$4.51 billion had left in June - plus one dovish sentence from a Fed governor produced crypto's best month of 2026. The first week of September has already shown that the same money can leave as quickly as it arrived.
For traders, that argues for respecting the move without extrapolating it. For anyone building or allocating in Asia, the more useful number is not Bitcoin's price but Indonesia's August volume print, due in a few weeks - because it answers a question the price chart cannot: whether 22.93 million account holders are actually trading this, or just watching it.
Join the Alpha Callers track at Web3 Week Asia 2026
Data sources: cryptocurrency price data as of 3 and 4 September 2026; US spot Bitcoin ETF monthly and daily flow data reported 2 September 2026; Federal Reserve commentary of early September 2026; and OJK monthly digital financial asset reporting through July 2026. Percentage changes measured against 29 July 2026 figures are calculated from previously published market data.